Convolution
from scipy import signal
import numpy as np
import matplotlib.pyplot as plt
%matplotlib inline
plt.rcParams["figure.dpi"]=150
plt.rcParams["figure.facecolor"]="white"

# define the first function, here Fermi-Dirac distribution
def f(E, kT):
    return 1/(np.exp(E/kT) + 1)

kT = 0.025; # corresponding to room temperature
E = np.linspace(-2, 2, 1000)

plt.rcParams.update({'font.size': 16})
plt.plot(E, f(E, kT), 'k')
plt.xlim(-0.5, 0.5)
plt.xlabel('$E - \mu$')
plt.ylabel('$f(E, kT)$')
plt.show()
# Define normalized Gassian funtion
def g(x, sigma):
    return (1/(sigma*np.sqrt(2*np.pi)))*np.exp(-x**2/(2*sigma*sigma))

x = np.linspace(-2, 2, 1000)
sigma = 0.2/(2*np.sqrt(2*np.log(2)))  # convert full width at half maxima

plt.plot(x, g(x, fwhm), 'g')
plt.xlim(-0.5, 0.5)
plt.xlabel('$x$')
plt.ylabel('$g(x)$')
plt.show()
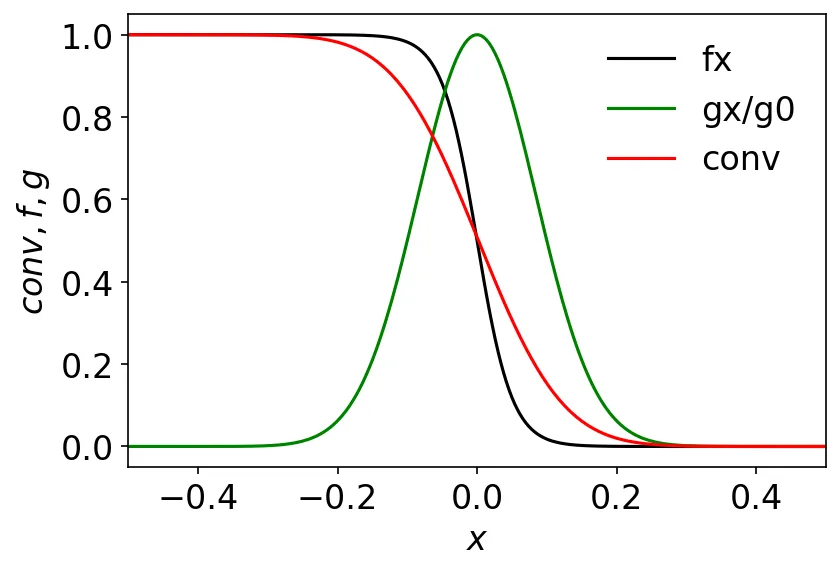
fx = f(E, kT)
gx = g(x, sigma)
g0 = g(0, sigma)
conv = signal.convolve(fx, gx, mode='same')/sum(gx)

plt.plot(E, fx, 'k', label='fx')
plt.plot(x, gx/g0, 'g', label= 'gx/g0')
plt.plot(x, conv, 'r', label='conv')
plt.xlabel('$x$')
plt.ylabel('$conv, f, g$')
plt.xlim(-0.5, 0.5)
plt.legend(frameon=False)
plt.show()

note
Here we have created the functions in the x-range [-2, 2], and plotted in the x-range [-0.5, 0.5] in order to avoid the edges during convolution.