Two dependent (y) axes using twinx
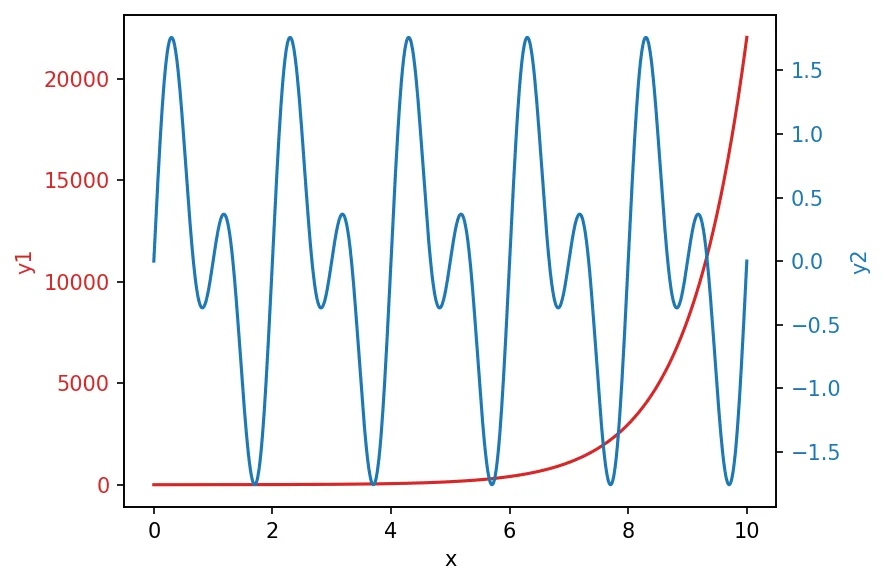
Sometimes we need to plot two dependent variables that have very different scaling but they are the function of same independent variable. In such cases, we can use two separate y-axes on both sides of the figure.
import numpy as np
import matplotlib.pyplot as plt
%matplotlib inline
plt.rcParams["figure.dpi"]=150
plt.rcParams["figure.facecolor"]="white"

# Create some mock data
x = np.linspace(0, 10, 1000)
y1 = np.exp(x)
y2 = np.sin(np.pi*x) + np.sin(2*np.pi*x)

fig, ax1 = plt.subplots()

ax1.set_xlabel('x')
ax1.set_ylabel('y1', color='tab:red')
ax1.plot(x, y1, color='tab:red')
ax1.tick_params(axis='y', labelcolor='tab:red')

ax2 = ax1.twinx()  # instantiate a second axes that shares the same x-axis

ax2.set_ylabel('y2', color='tab:blue')  # x-label is handled with ax1
ax2.plot(x, y2, color='tab:blue')
ax2.tick_params(axis='y', labelcolor='tab:blue')

fig.tight_layout()  # otherwise the right y-label is slightly clipped
plt.show()