Customizing matplotlib plots
You can customize every aspect of Matplotlib according to your needs and likes.
If you want to apply certain set of styles universally, you can edit the
matplotlibrc file. In macOS, the files resides in
/Library/Frameworks/Python.framework/Versions/3.7/lib/python3.7/site-packages/matplotlib/mpl-data/matplotlibrc.
The path may differ depending on your installation type and operating system.
You can edit the file there, but the problem is it will be overwritten if you
upgrade matplotlib. To avoid overwriting, copy the file to
~/.matplotlib/matplotlibrc and edit under your home directory. The
matplotlibrc file locations maybe different depending on the operating system.
You can get a copy of sample matplotlibrc file here.
Unfortunately, some settings are not correctly applied while using
%matplotlib inline in Jupyter notebook. Settings we need to apply in the
Jupyter notebook:
plt.rcParams["figure.figsize"] = (8, 6)
plt.rcParams["figure.dpi"] = 150
Interactive backend
If you want interactive plots, like ability to zoom, pan, read cursor position etc., you can use notebook backend in your jupyter notebook:
%matplotlib notebook
The notebook interactive mode does not work in Jupyterlab at the moment, it is
only supported in classic notebooks. However, you can install ipympl backend
and instead use:
%matplotlib widget
There are also Qt based backend that can show plot on it's own window and allows more interactivity.
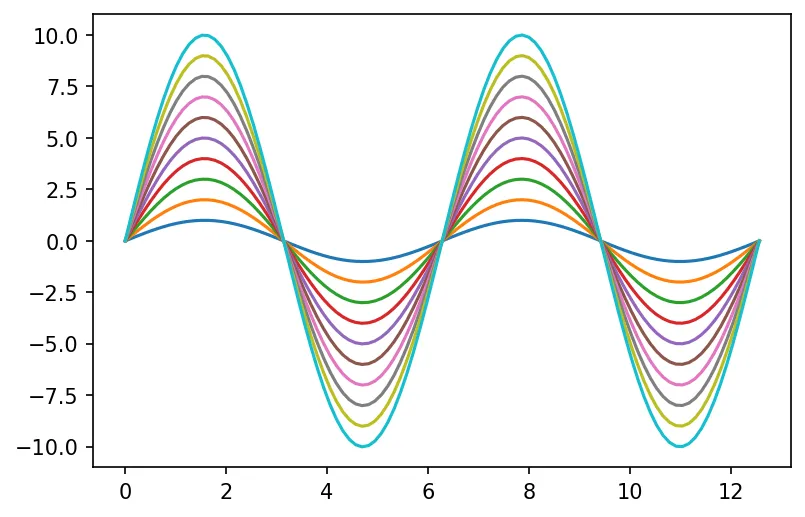
Overriding default colors
import numpy as np
import matplotlib.pyplot as plt
%matplotlib inline
plt.rcParams["figure.dpi"]=150
plt.rcParams["figure.facecolor"]="white"

color = ['#CD6155','#808B96','#9B59B6','#99A3A4','#7D6608',\
         '#F39C12','#2980B9','#16A085','#ABEBC6','#AED6F1']

x = np.linspace(0, 4*np.pi, 100)

for i in range(10):
    plt.plot(x, (i+1)*np.sin(x))
plt.show()