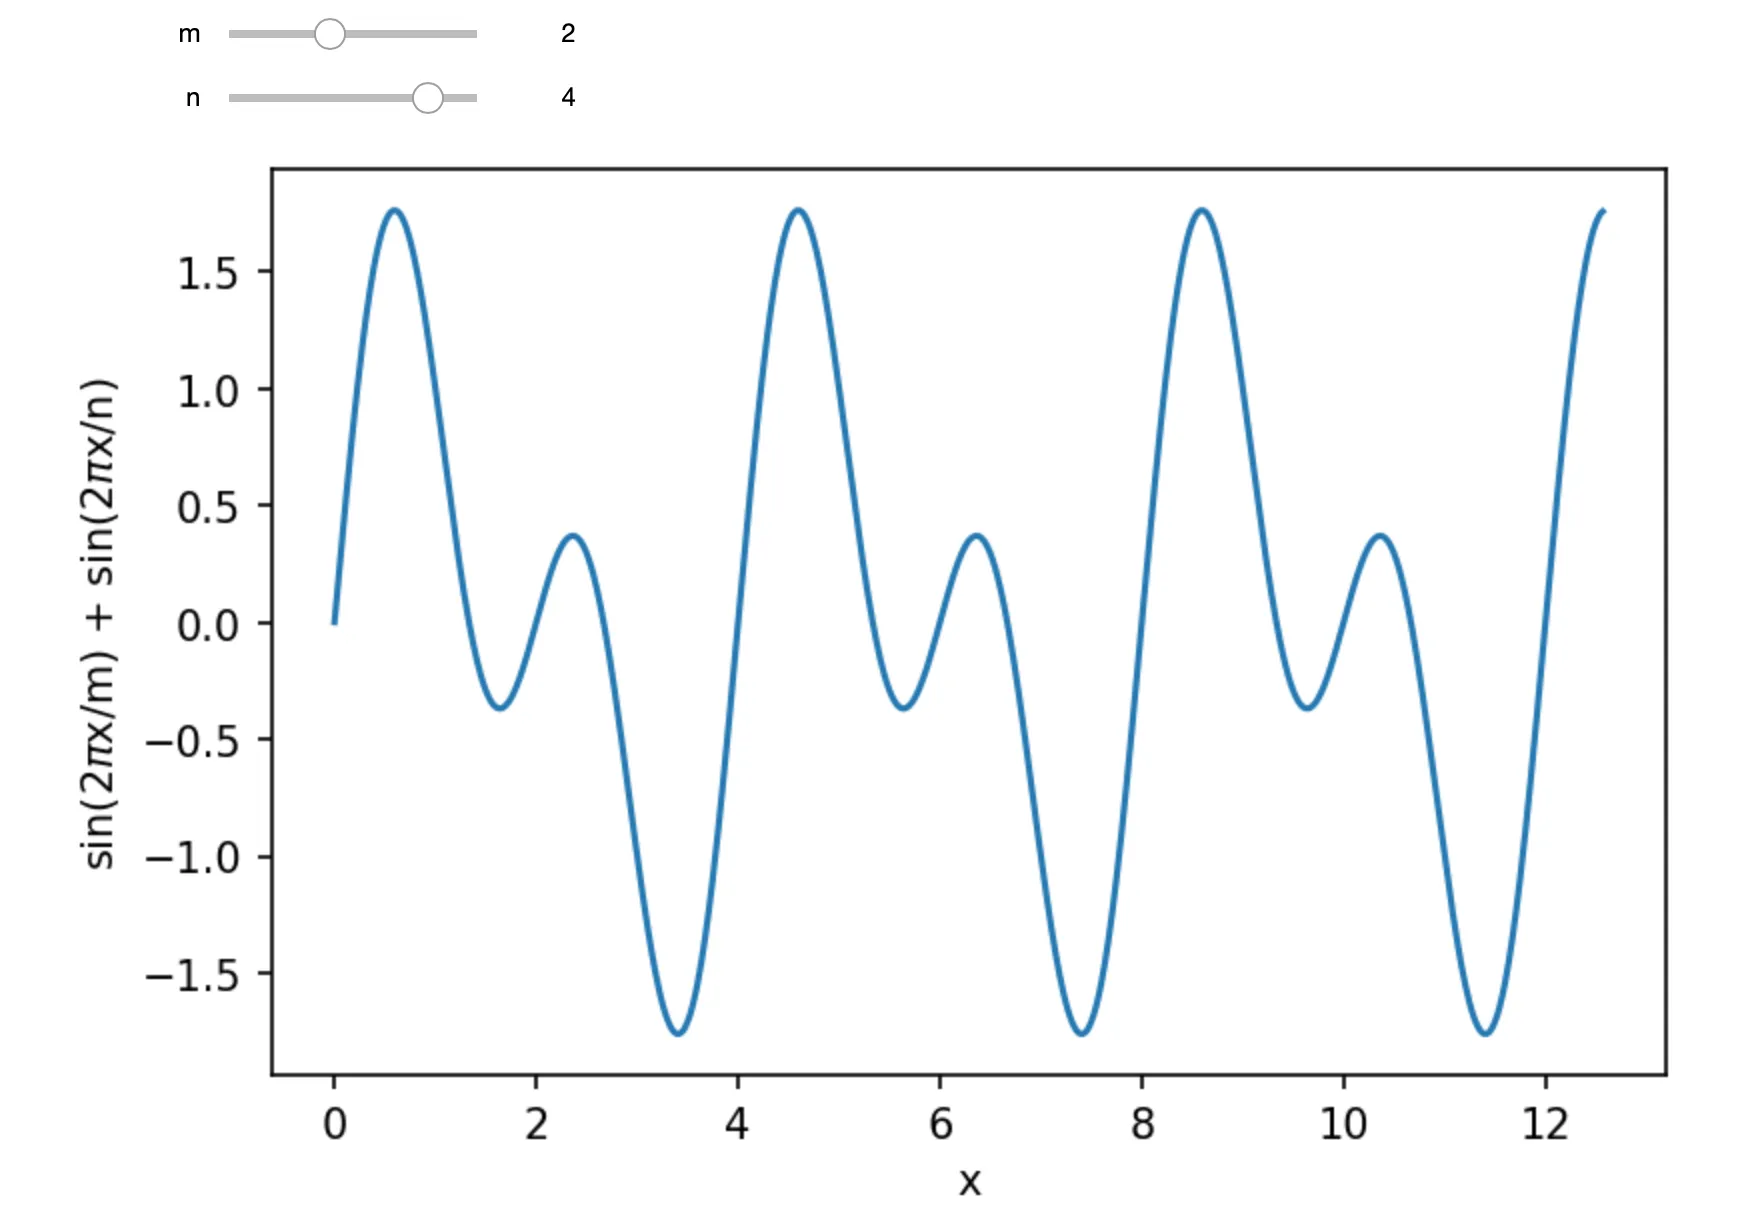
Interactive plots using ipywidgets
import numpy as np
import matplotlib.pyplot as plt
from ipywidgets import interactive
%matplotlib inline
plt.rcParams["figure.dpi"]=150
plt.rcParams["figure.facecolor"]="white"

def plot_func(m, n):
    x = np.linspace(0, 4*np.pi, num=1000)
    y = np.sin(2*np.pi*x/m) + np.sin(2*np.pi*x/n)
    plt.plot(x, y)
    plt.xlabel("x")
    plt.ylabel("sin(2$\\pi$x/m) + sin(2$\\pi$x/n)")
    plt.show()

interactive_plot = interactive(plot_func, m=(0, 5, 1), n=(0, 5, 1))
output = interactive_plot.children[-1]
interactive_plot

Please try the interactive slider in a jupyter notebook, and see how the figure changes.