Creating custom colormaps
Matplotlib includes wonderful colormaps. Moreover, it is possible to create any custom colormap we want. We need the RGB values in a file. We could also include alpha (transparency) values in 4th column.
import matplotlib.pyplot as plt
%matplotlib inline
plt.rcParams["figure.dpi"]=150
plt.rcParams["figure.facecolor"]="white"
import sys
sys.path.append("/root/")
# https://github.com/pranabdas/arpespythontools
import arpespythontools as arp
def create_cmap(data_path):
import numpy as np
from matplotlib.colors import ListedColormap
contents = open(data_path, "r").readlines()
cmap_length = len(contents)
cmap = np.ndarray((cmap_length, 4))
for ii in range(cmap_length):
cmap_row = contents[ii][:-1].split('\t')
cmap[ii, 0] = cmap_row[0]
cmap[ii, 1] = cmap_row[1]
cmap[ii, 2] = cmap_row[2]
cmap[ii, 3] = 1 # Default alpha
cmap = ListedColormap(cmap)
return cmap
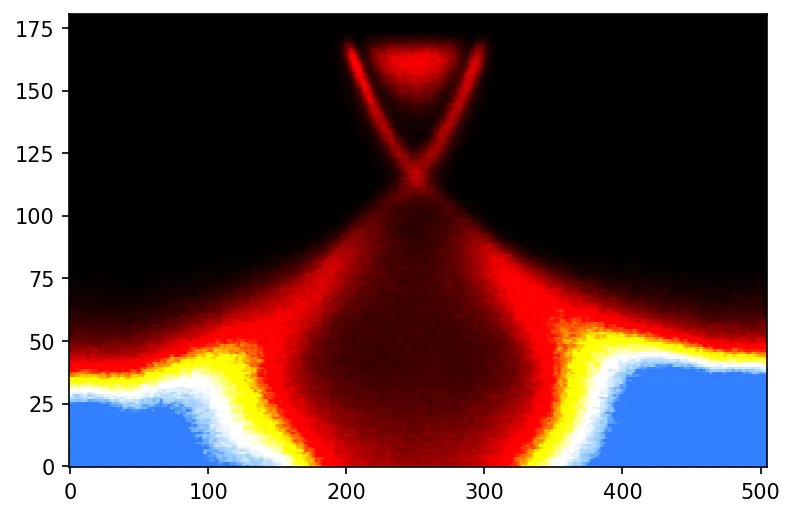
my_cmap = create_cmap("../datafiles/cmap_blue_hot.dat")
[data, x, y] = arp.import_itx('../datafiles/GX.itx')
plt.imshow(data, aspect='auto', origin="lower", interpolation='none', \
filterrad=4.0, cmap=my_cmap, vmin=0, vmax=600)
# plt.set_cmap('gist_heat_r')
plt.show()