gnuplot
Installation
On Ubuntu/Debian:
apt install gnuplot
On macOS:
brew install aquaterm --cask
brew install gnuplot --with-aquaterm --with-qt5
Now you can access gnuplot by gnuplot command on the terminal.
Basic plotting
Plot a function:
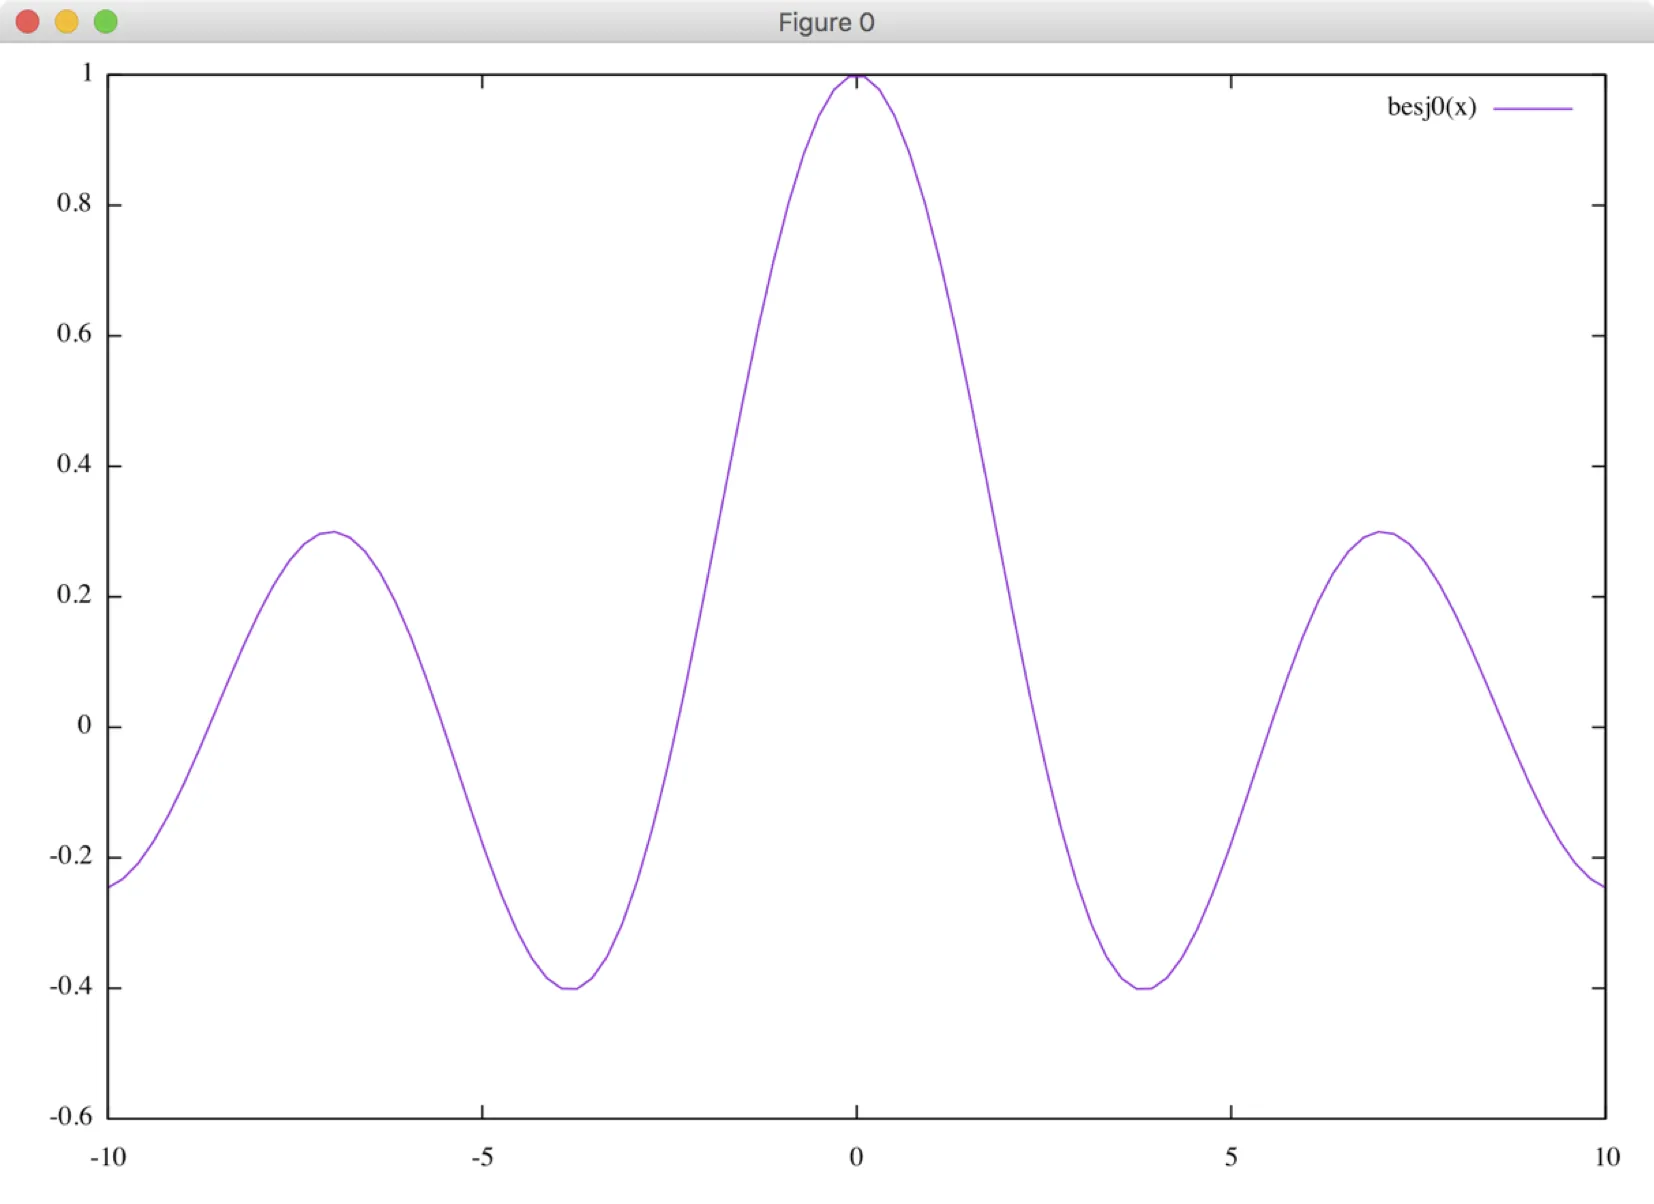
gnuplot> plot besj0(x)
Maybe you want fix the x-range:
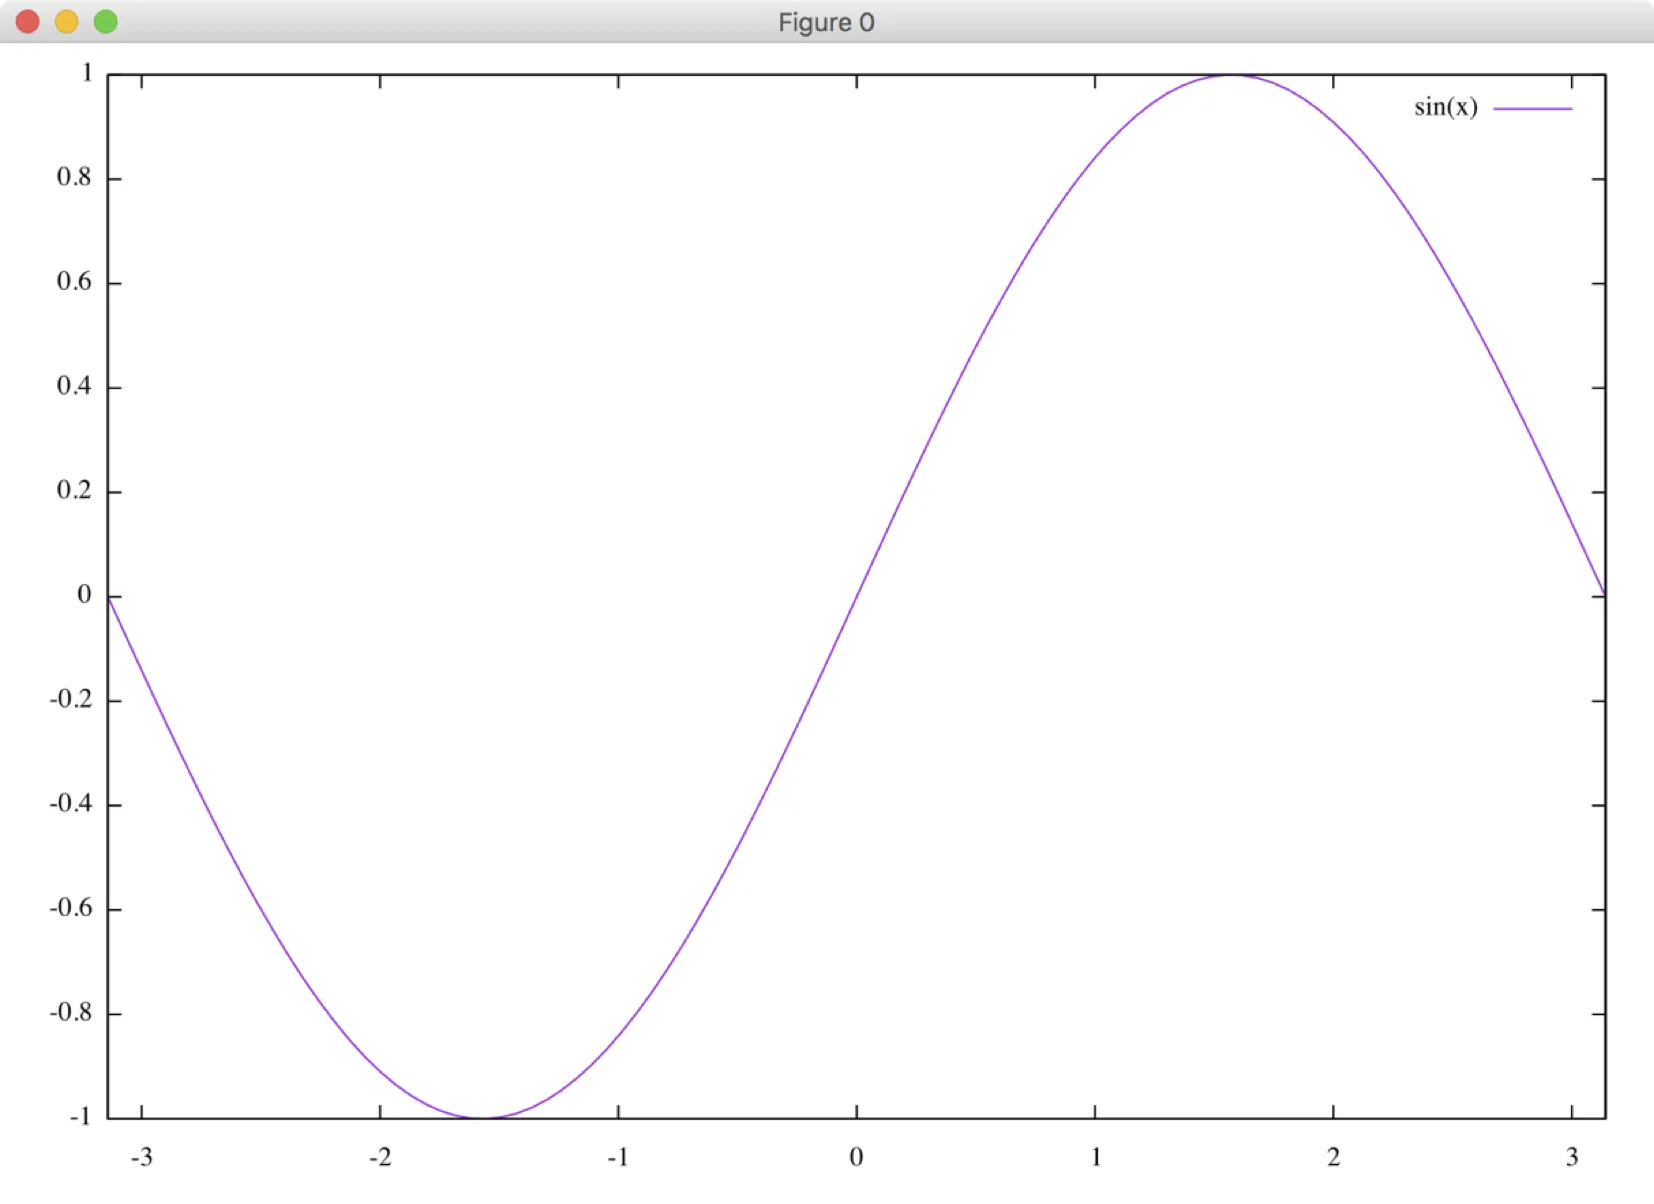
gnuplot> plot [-pi:pi] sin(x)
Maybe you want fix both x and y-range:
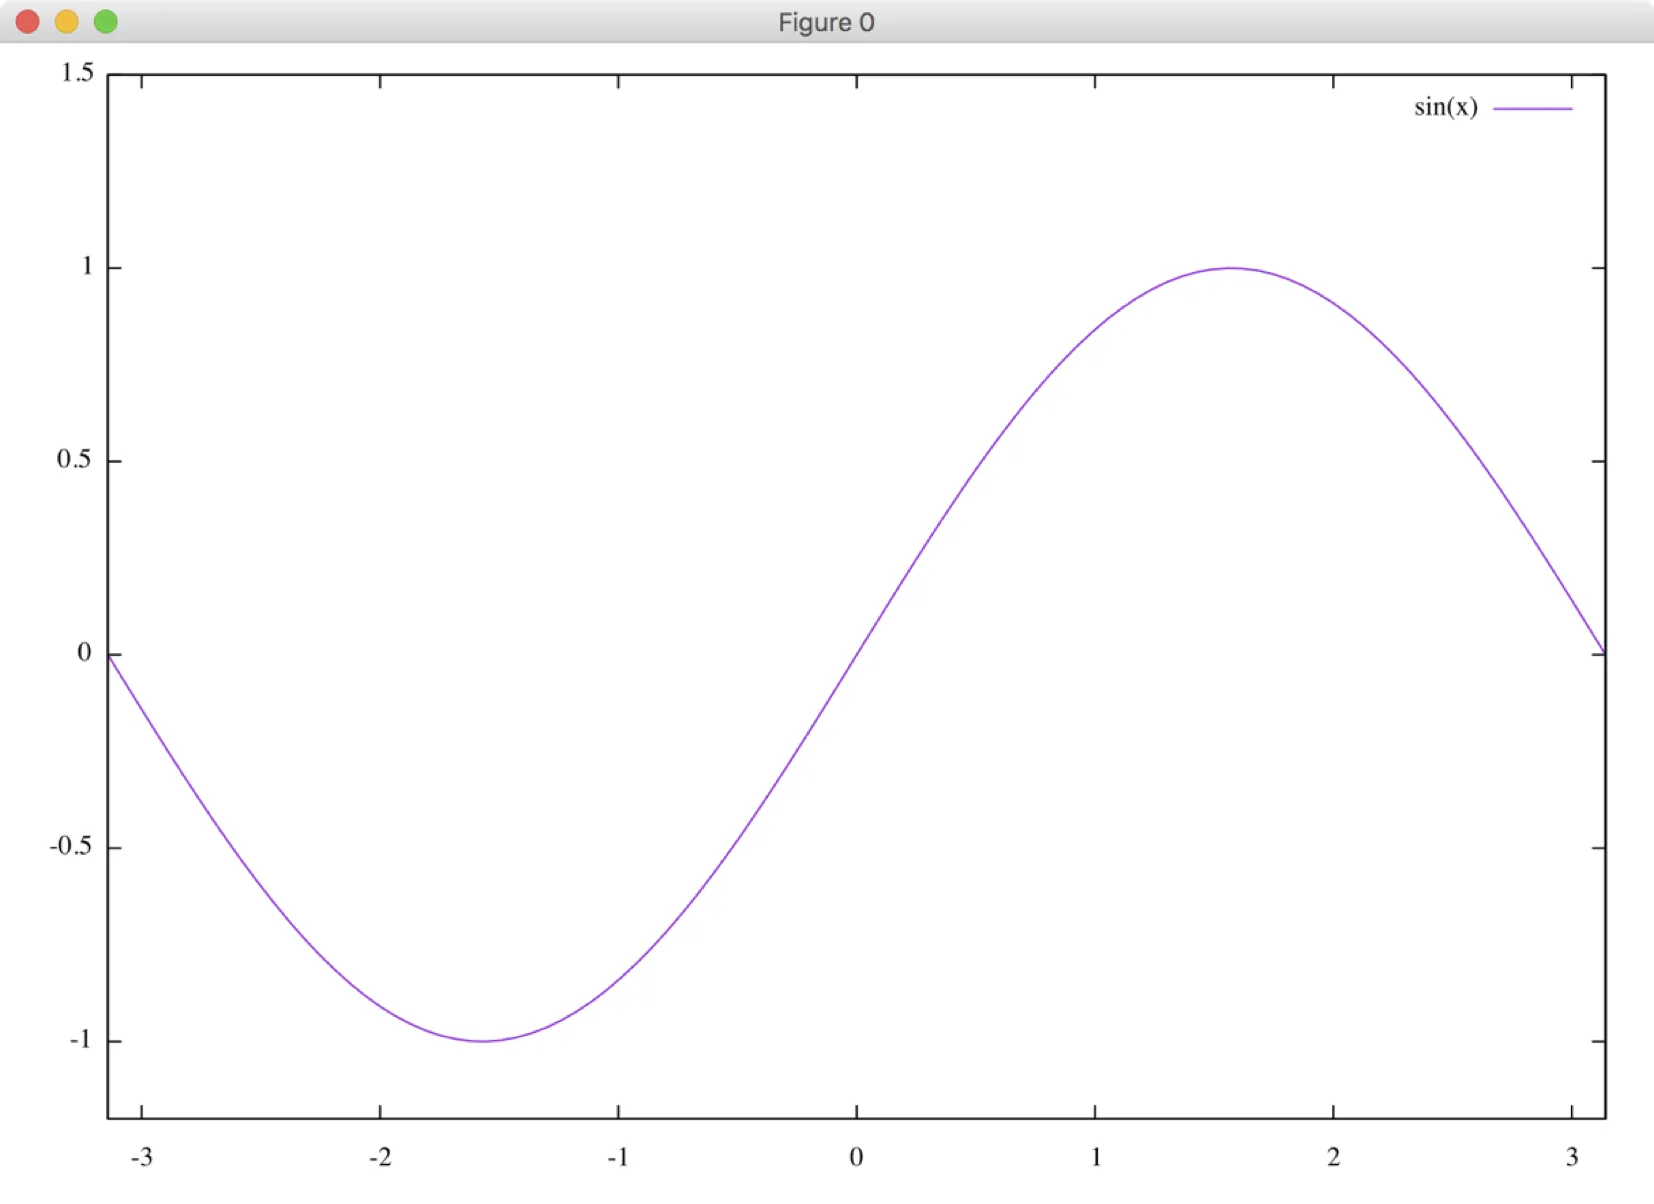
gnuplot> plot [-pi:pi] [-1.2:1.5] sin(x)
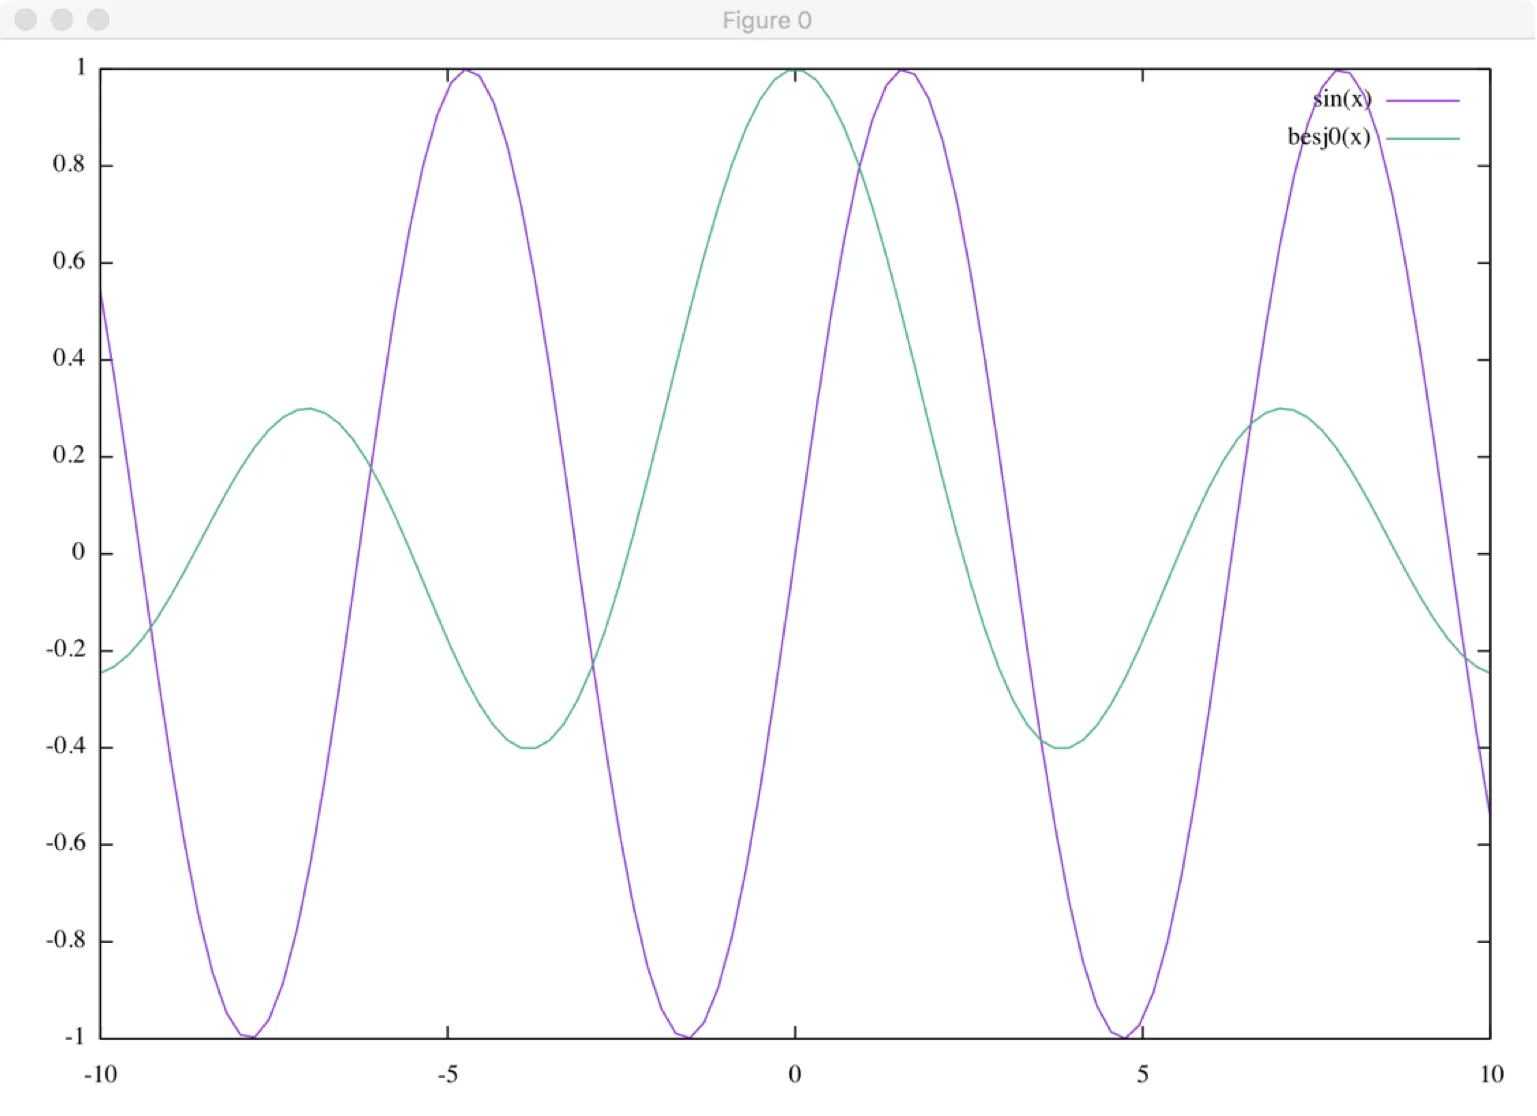
Plotting multiple functions at the same time:
gnuplot> plot sin(x), besj0(x)
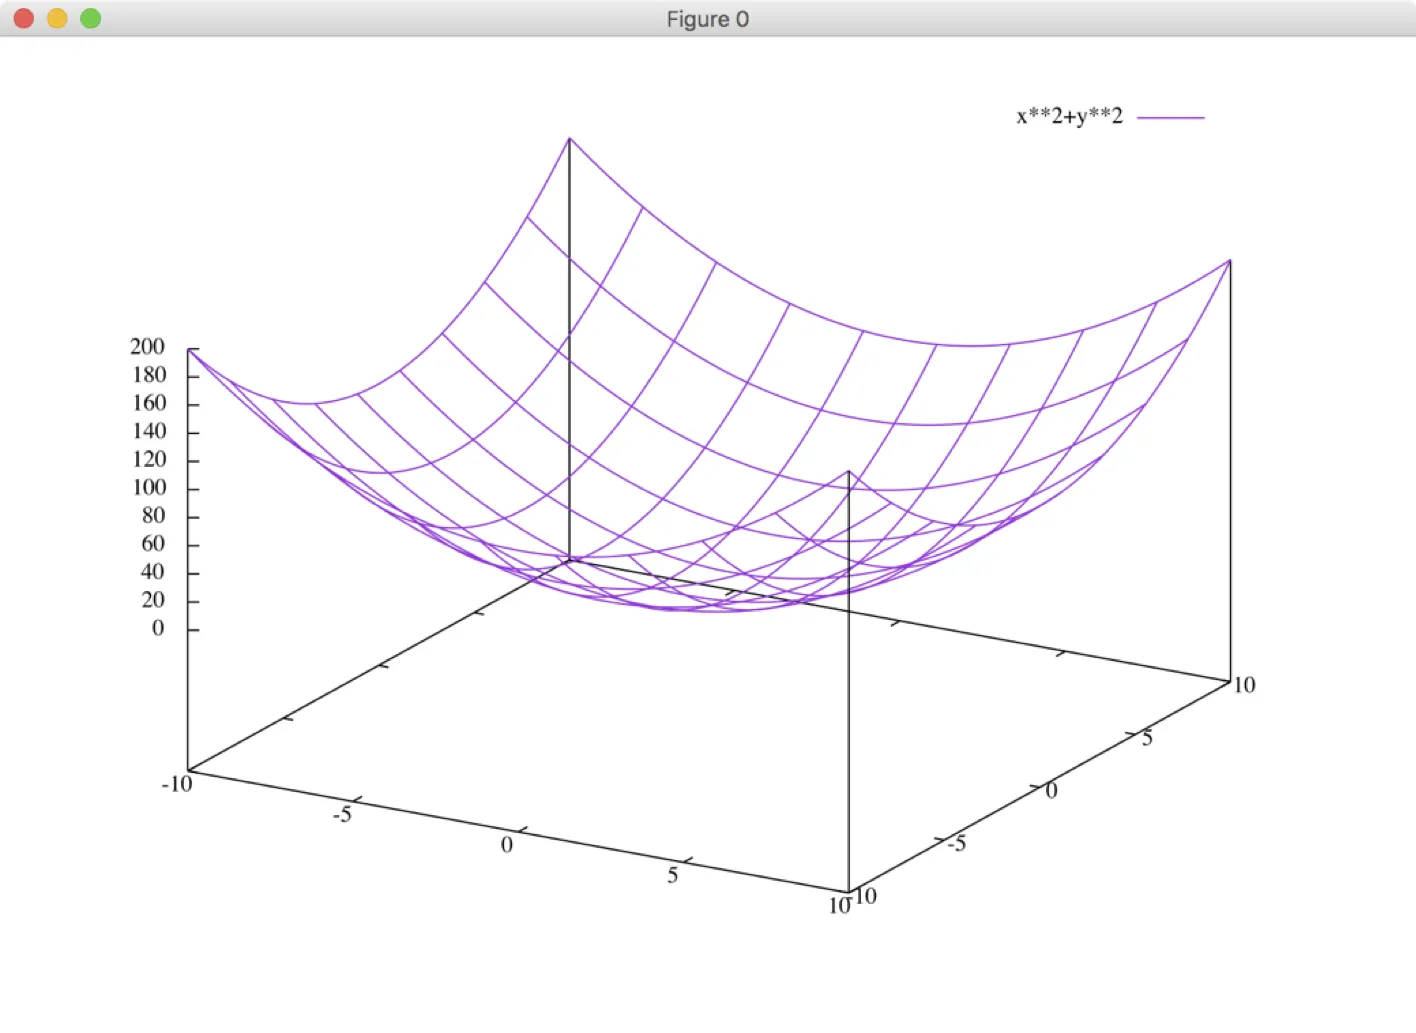
Making surface plot
gnuplot> splot x**2+y**2
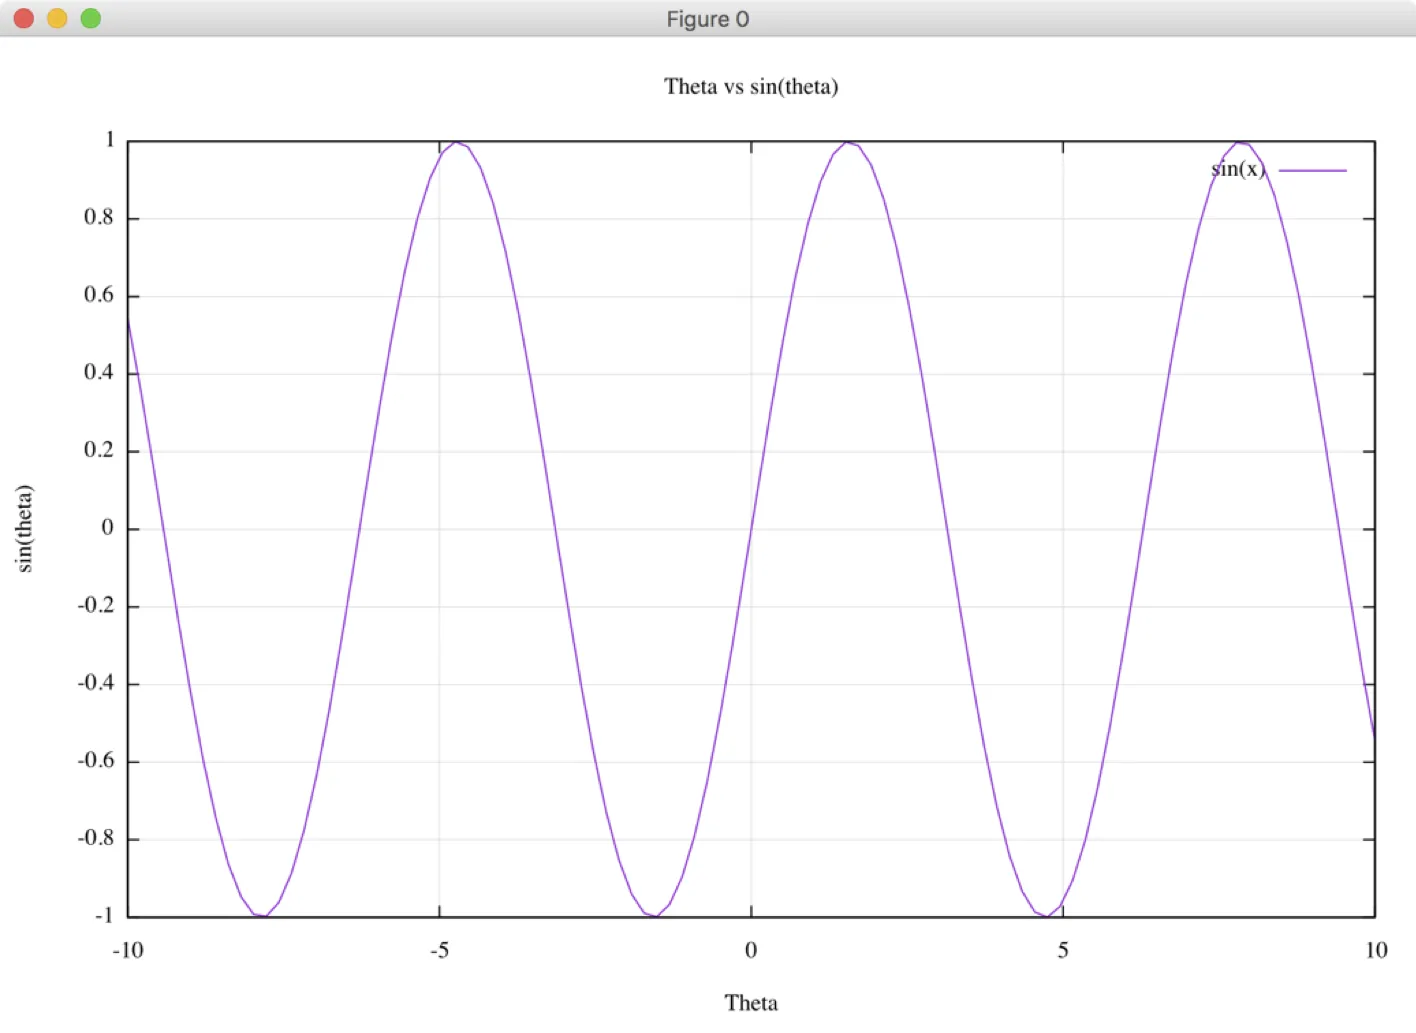
Making things look prettier, setting grid:
gnuplot> set grid
gnuplot> plot sin(x)
you may use replot to plot previous plot
gnuplot> set grid
gnuplot> set xlabel "Theta"
gnuplot> set ylabel "Sin(Theta)"
gnuplot> set title "Theta vs. Sin(theta)"
gnuplot> replot
Plotting data from file (the file contains two column data)
gnuplot> plot "file.txt"
Specify columns to plot
gnuplot> plot "file.txt" u 1:2
You can combine function plot with plot using data files
gnuplot> plot "file.txt", sin(x)
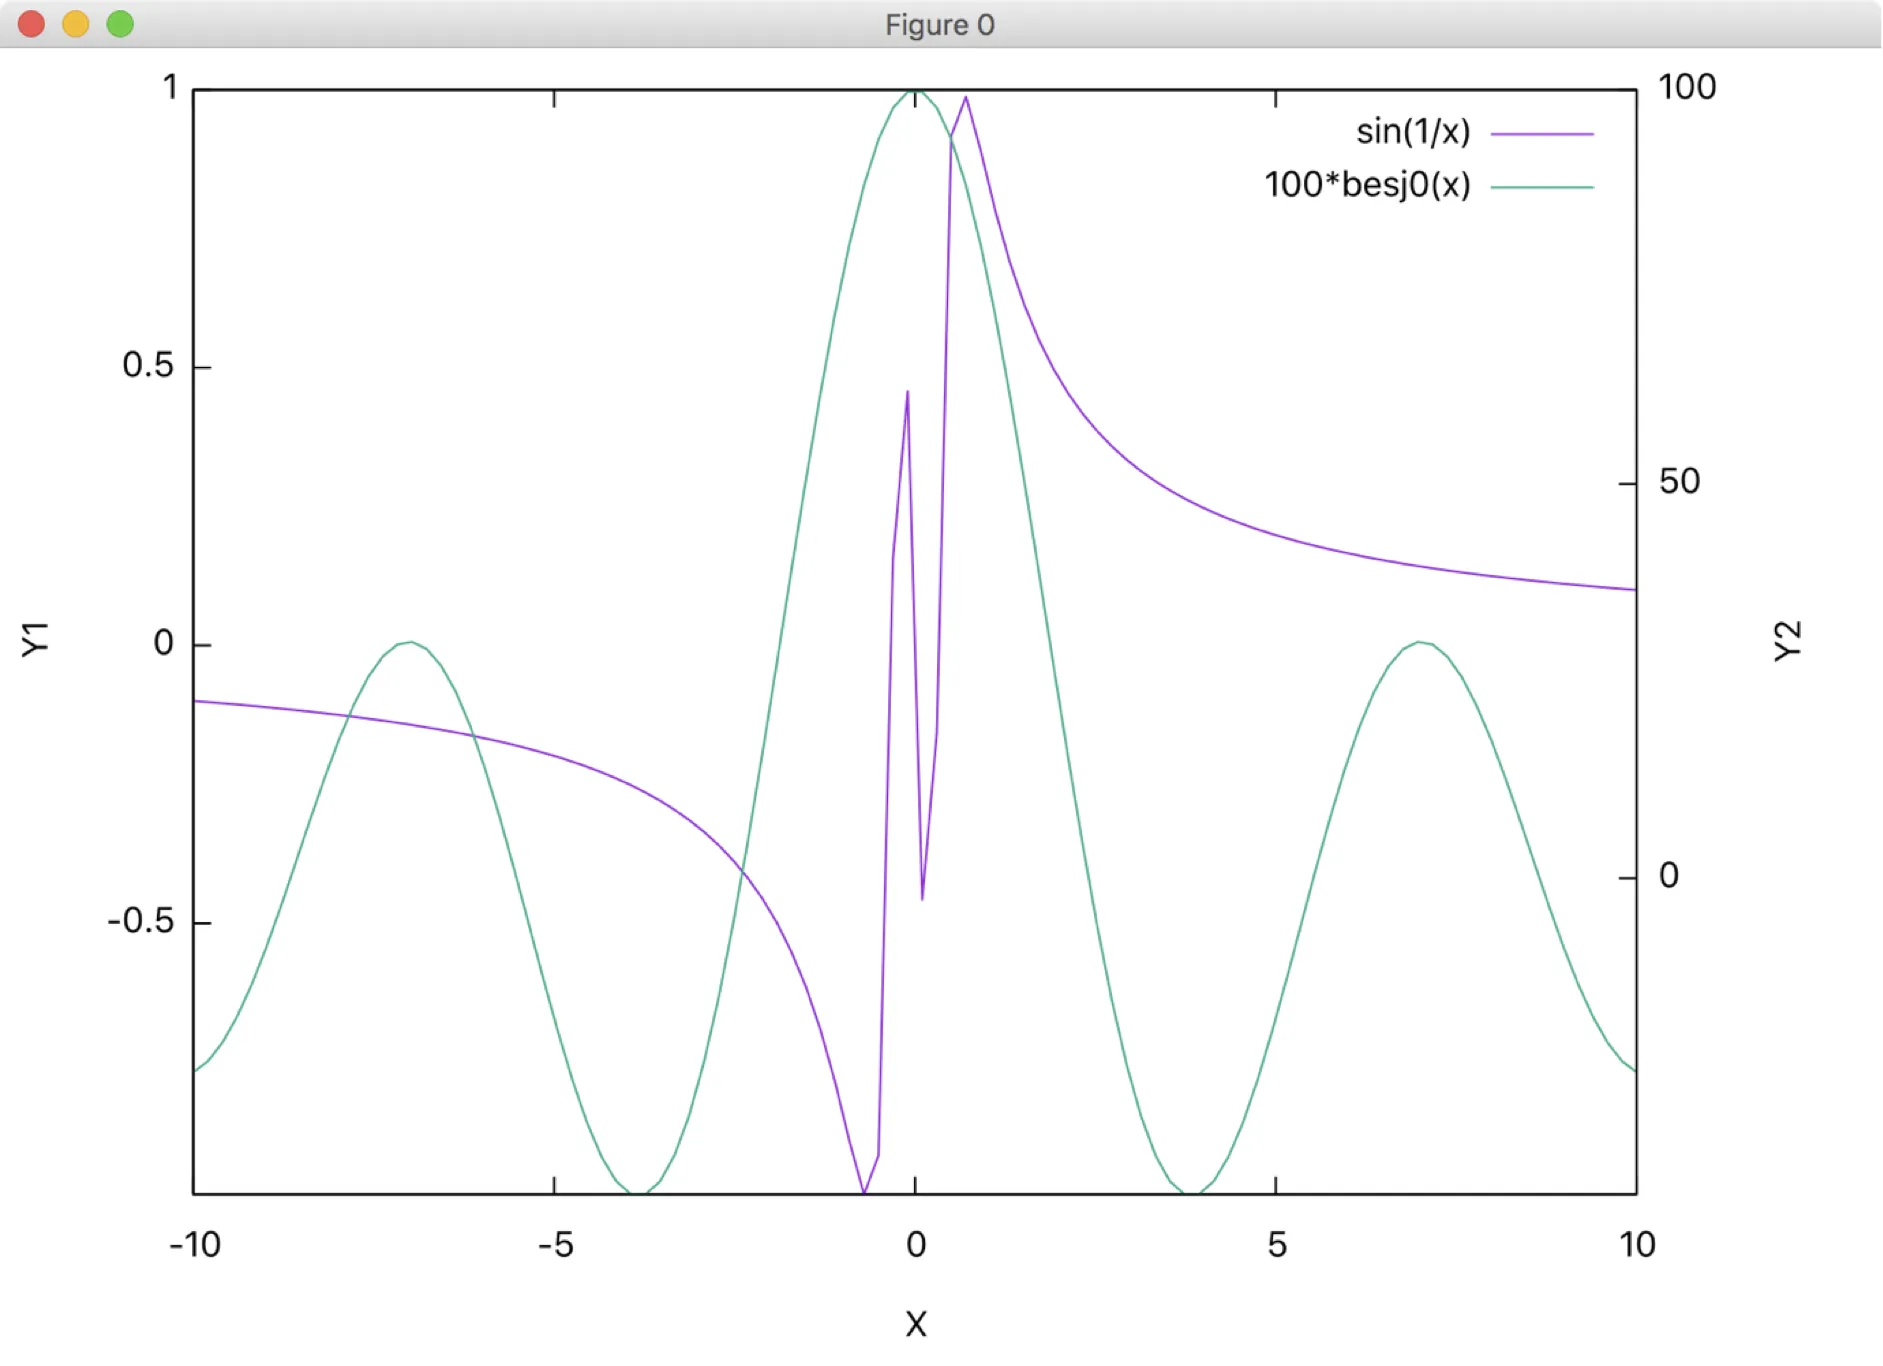
Two dependent y-axes
gnuplot> set terminal aqua font "Segue UI Light, 16"
gnuplot> set ytics nomirror
gnuplot> set y2tics -50, 50
gnuplot> plot sin(1/x) axis x1y1, 100*besj0(x) axis x1y2
gnuplot> set ytics -1, 0.5
gnuplot> set ylabel "Y1"
gnuplot> set y2label "Y2"
gnuplot> set xlabel "X"
gnuplot> replot
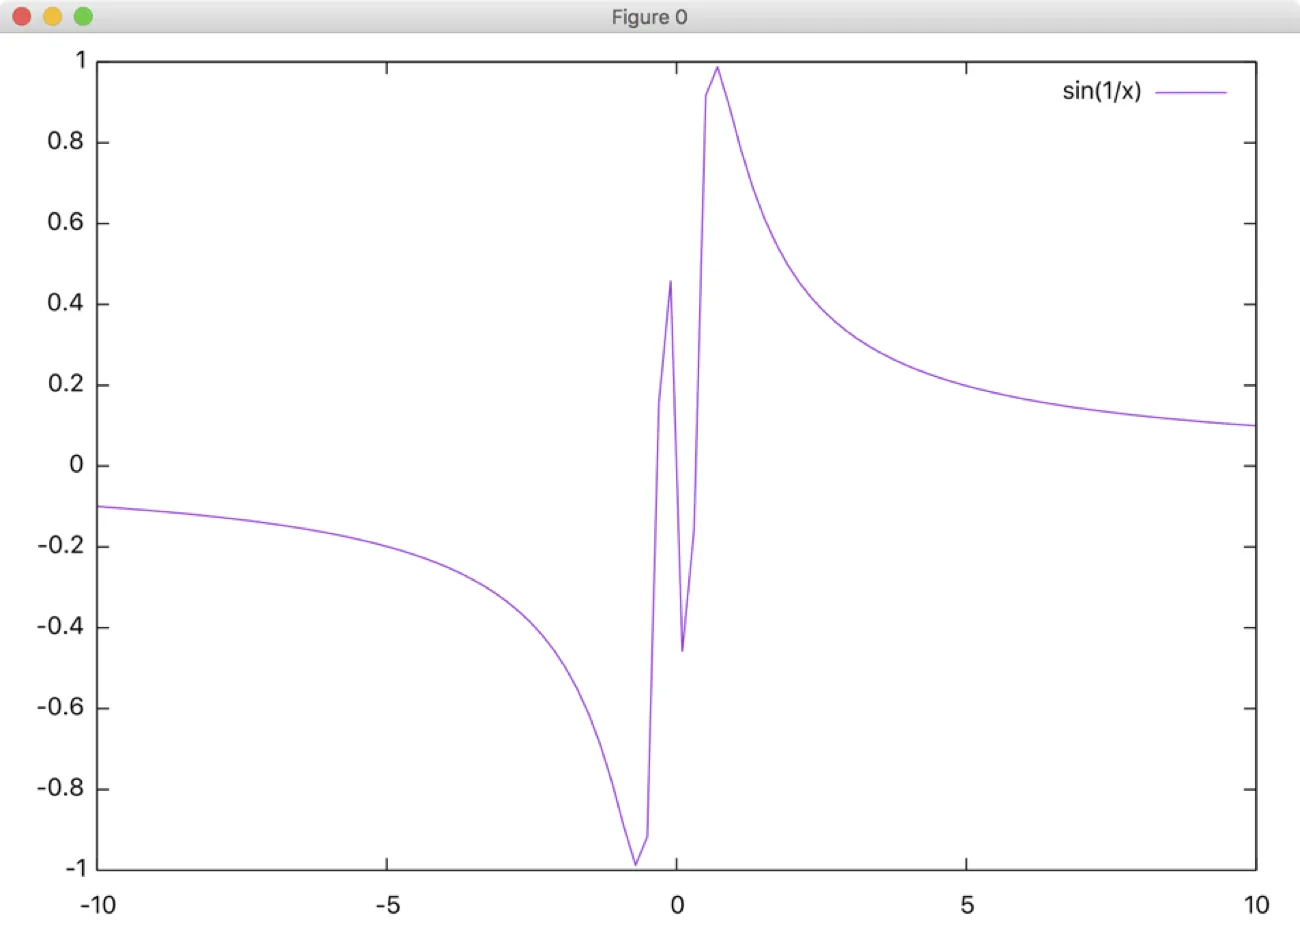
Sample size
Set samples size in Gnuplot while plotting functions. Sometimes the finest features of a function cannot be seen using default sample size, try this following example.
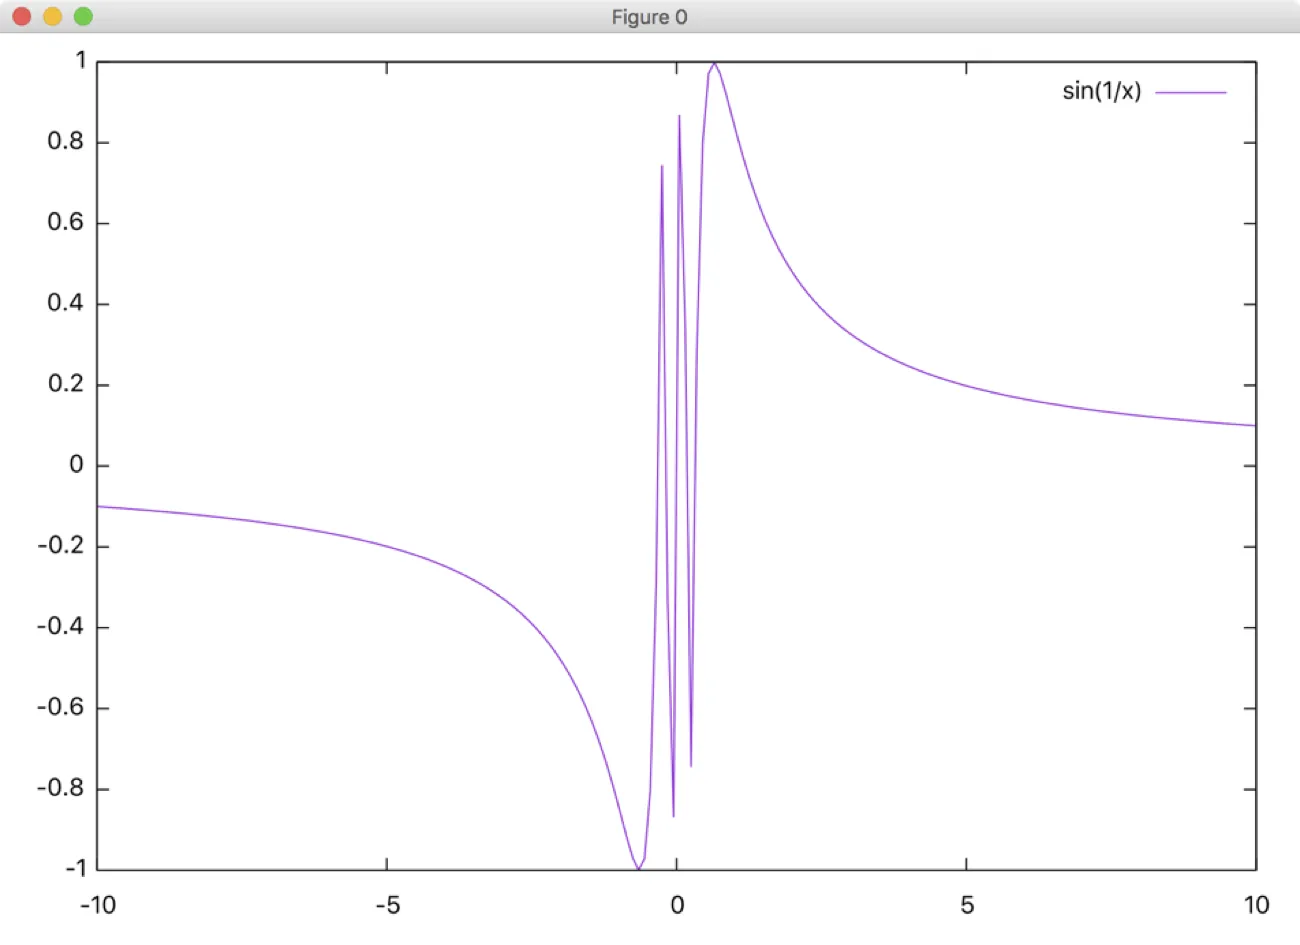
gnuplot> plot sin(1/x)
gnuplot> set samples 200
gnuplot> replot