Extracting line profile
How can we extract line profile from our two-dimensional image data? The
function line_profile does the work. Let's say we want to extract an energy
distribution curve (EDC) from our ARPES spectrum.
import arpespythontools as arp
data, energy, angle = arp.load_ses_spectra('sample_spectra.txt')

# extract line profile between angles (-3, 3)
edc = arp.line_profile(data, angle, -3, 3)

# Plot image
import matplotlib.pyplot as plt
%matplotlib inline
# Above line is specific to Jupyter Notebook
plt.figure(figsize = (8, 6))
plt.plot(energy, edc/max(edc))
plt.xlabel('$E_{kin}$ (eV)')
plt.ylabel('Intensity (a.u)')
plt.show()

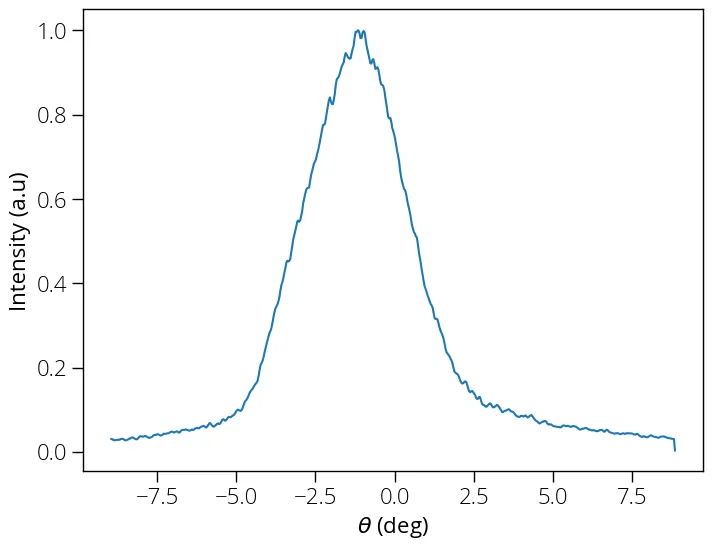
How about if we want the momentum distribution curve (MDC) instead? That means we have to extract line profile along the other axis, which can be done by transposing the data, and interchanging the axes:
# extract line profile between energy values (16.5, 16.7)
mdc = arp.line_profile(data.T, energy, 16.5, 16.7)

# Plot image
import matplotlib.pyplot as plt
%matplotlib inline
# Above line is specific to Jupyter Notebook
plt.figure(figsize = (8, 6))
plt.plot(angle, mdc/max(mdc))
plt.xlabel('$\\theta$ (deg)')
plt.ylabel('Intensity (a.u)')
plt.show()
tip
If you do not need to specify the integration limits i.e., you want to sum over
full angle (in case of EDC) or energy (in case MDC) range, it is simpler to use
numpy.sum method instead.
import numpy as np
edc = np.sum(data, axis=1)
mdc = np.sum(data, axis=0)